

Handling stolen goods
Legislation: Crimes Act 1958 (Vic) s 88(1)
Maximum penalty: 15 years imprisonment
Period: 1 July 2020 to 30 June 2023
Jurisdiction: Magistrates' Court
*Note: unavailable options have under 10 cases
Sentencing outcomes for all charges of handling stolen goods
Number: 13,871 charges
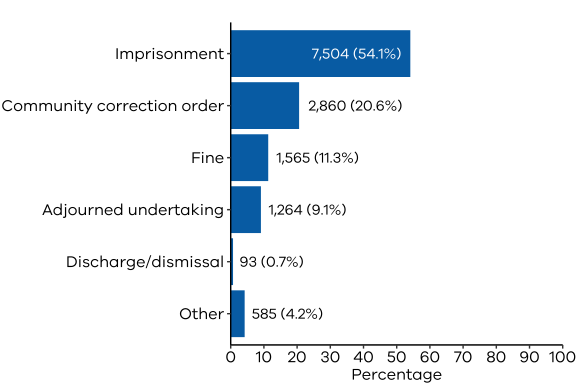
See Table 1 in the Excel data file for the data in this graph.
Imprisonment lengths for charges of handling stolen goods
Number: 441 charges

Note: The graph only includes imprisonment that was not part of an aggregate sentence (non-aggregate imprisonment)
See Table 2 in the Excel data file for the data in this graph.
Community correction order lengths for charges of handling stolen goods
Number: 2,860 charges
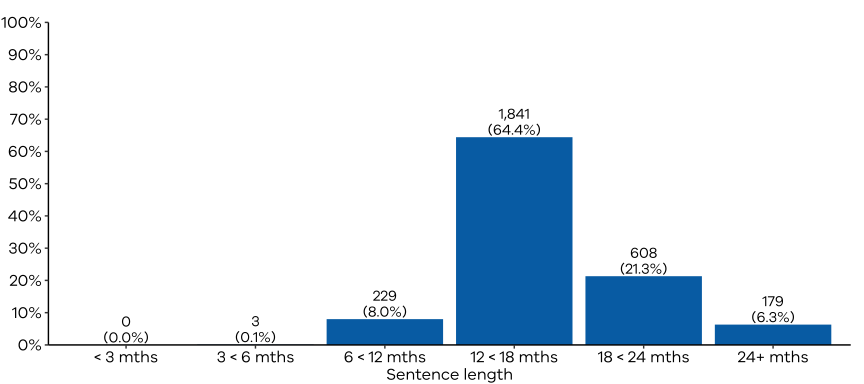
See Table 3 in the Excel data file for the data in this graph.
Fine amounts for charges of handling stolen goods
Number: 161 charges
Note: The graph only includes fines that were not part of an aggregate sentence (non-aggregate fines).

See Table 4 in the Excel data file for the data in this graph.
Sentencing outcomes for all charges of handling stolen goods by financial year
Number: 13,871 charges

See Table 5 in the Excel data file for the data in this graph.
Number of charges of handling stolen goods by financial year
Number: 13,871 charges
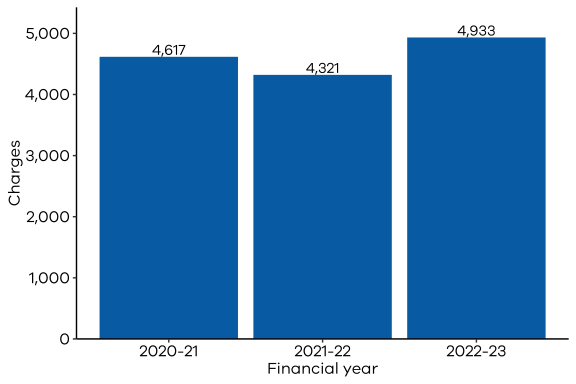
See Table 6 in the Excel data file for the data in this graph.
Average imprisonment lengths for charges of handling stolen goods by financial year
Number: 441 charges
Note: The graph only includes imprisonment that was not part of an aggregate sentence (non-aggregate imprisonment).

See Table 7 in the Excel data file for the data in this graph.
Average fine amounts for charges of handling stolen goods by financial year
Number: 161 charges
Note: The graph only includes fines that were not part of an aggregate sentence (non-aggregate fines).

See Table 8 in the Excel data file for the data in this graph.
Sentencing outcomes for all people for cases of handling stolen goods
Number: 8,000 cases
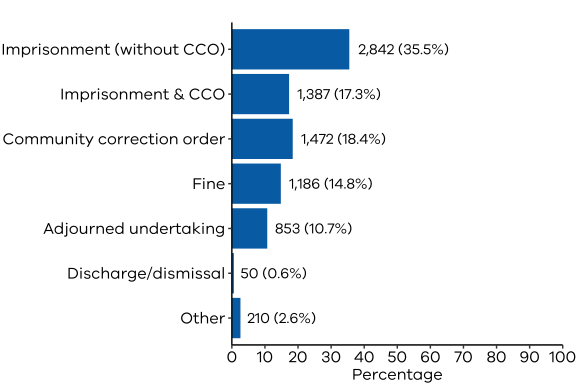
See Table 9A in the Excel data file for the data in this graph.
Sentencing outcomes for males for cases of handling stolen goods
Number: 6,299 cases

See Table 9B in the Excel data file for the data in this graph.
Sentencing outcomes for females for cases of handling stolen goods
Number: 1,701 cases
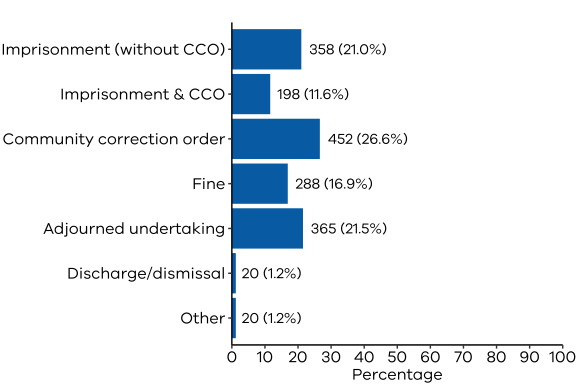
See Table 9C in the Excel data file for the data in this graph.
Sentencing outcomes for people aged under 25 for cases of handling stolen goods
Number: 1,254 cases
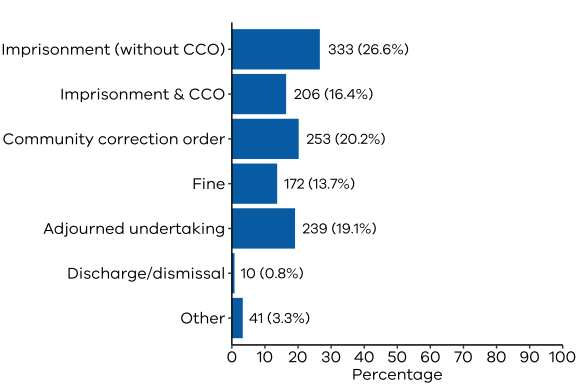
See Table 9D in the Excel data file for the data in this graph.
Sentencing outcomes for people aged 25 to 54 for cases of handling stolen goods
Number: 6,580 cases

See Table 9E in the Excel data file for the data in this graph.
Sentencing outcomes for people aged 55 and over for cases of handling stolen goods
Number: 146 cases
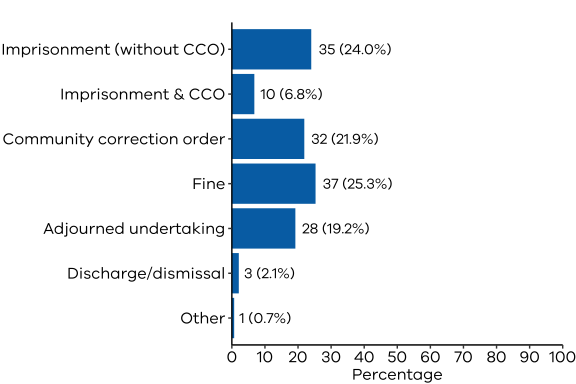
See Table 9F in the Excel data file for the data in this graph.
Imprisonment lengths for cases of handling stolen goods
Number: 4,229 cases, including imprisonment only (2,842 cases) and imprisonment combined with a community correction order (1,387 cases).
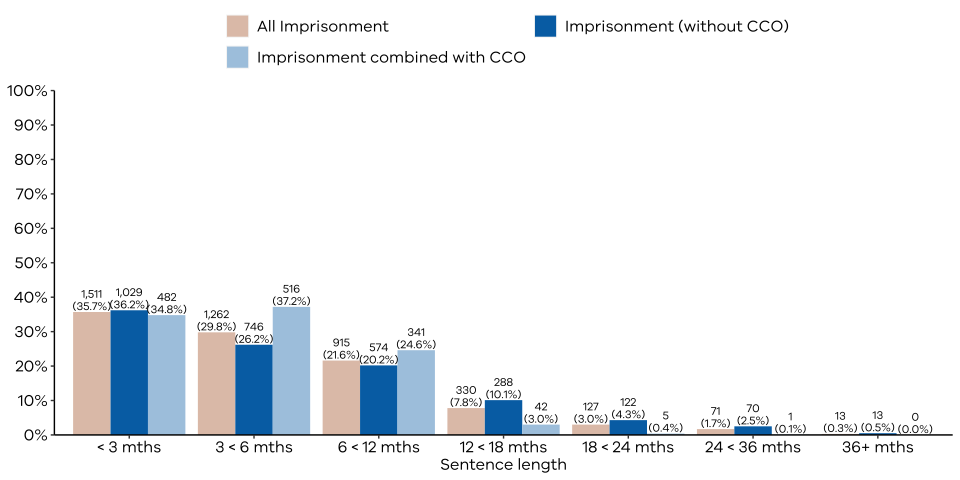
See Table 10 in the Excel data file for the data in this graph.
Non-parole periods for all people for cases of handling stolen goods
Number: 2,842 cases
Note: Imprisonment terms do not include a community correction order.

See Table 11 in the Excel data file for the data in this graph.
Community correction order lengths for cases of handling stolen goods
Number: 1,472 cases

See Table 12 in the Excel data file for the data in this graph.
Sentencing outcomes for all cases of handling stolen goods by financial year
Number: 8,000 cases

See Table 13 in the Excel data file for the data in this graph.
Number of cases of handling stolen goods for all people by financial year
Number: 8,000 cases

See Table 14 in the Excel data file for the data in this graph.
Average imprisonment lengths for cases of handling stolen goods by financial year
Number: 4,229 cases
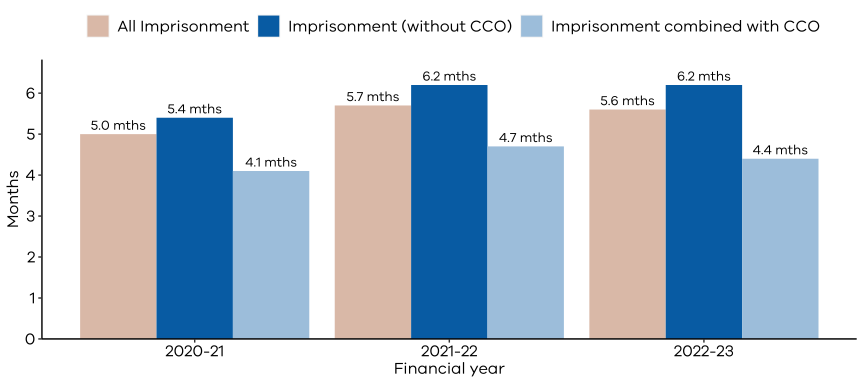
See Table 15 in the Excel data file for the data in this graph.
Average imprisonment lengths and non-parole periods (NPPs) for cases of handling stolen goods by financial year
Number: 366 cases
Note: NPP Cases in the graph indicates that only cases with a non-parole period are included.

See 16 in the Excel data file for the data in this graph.